
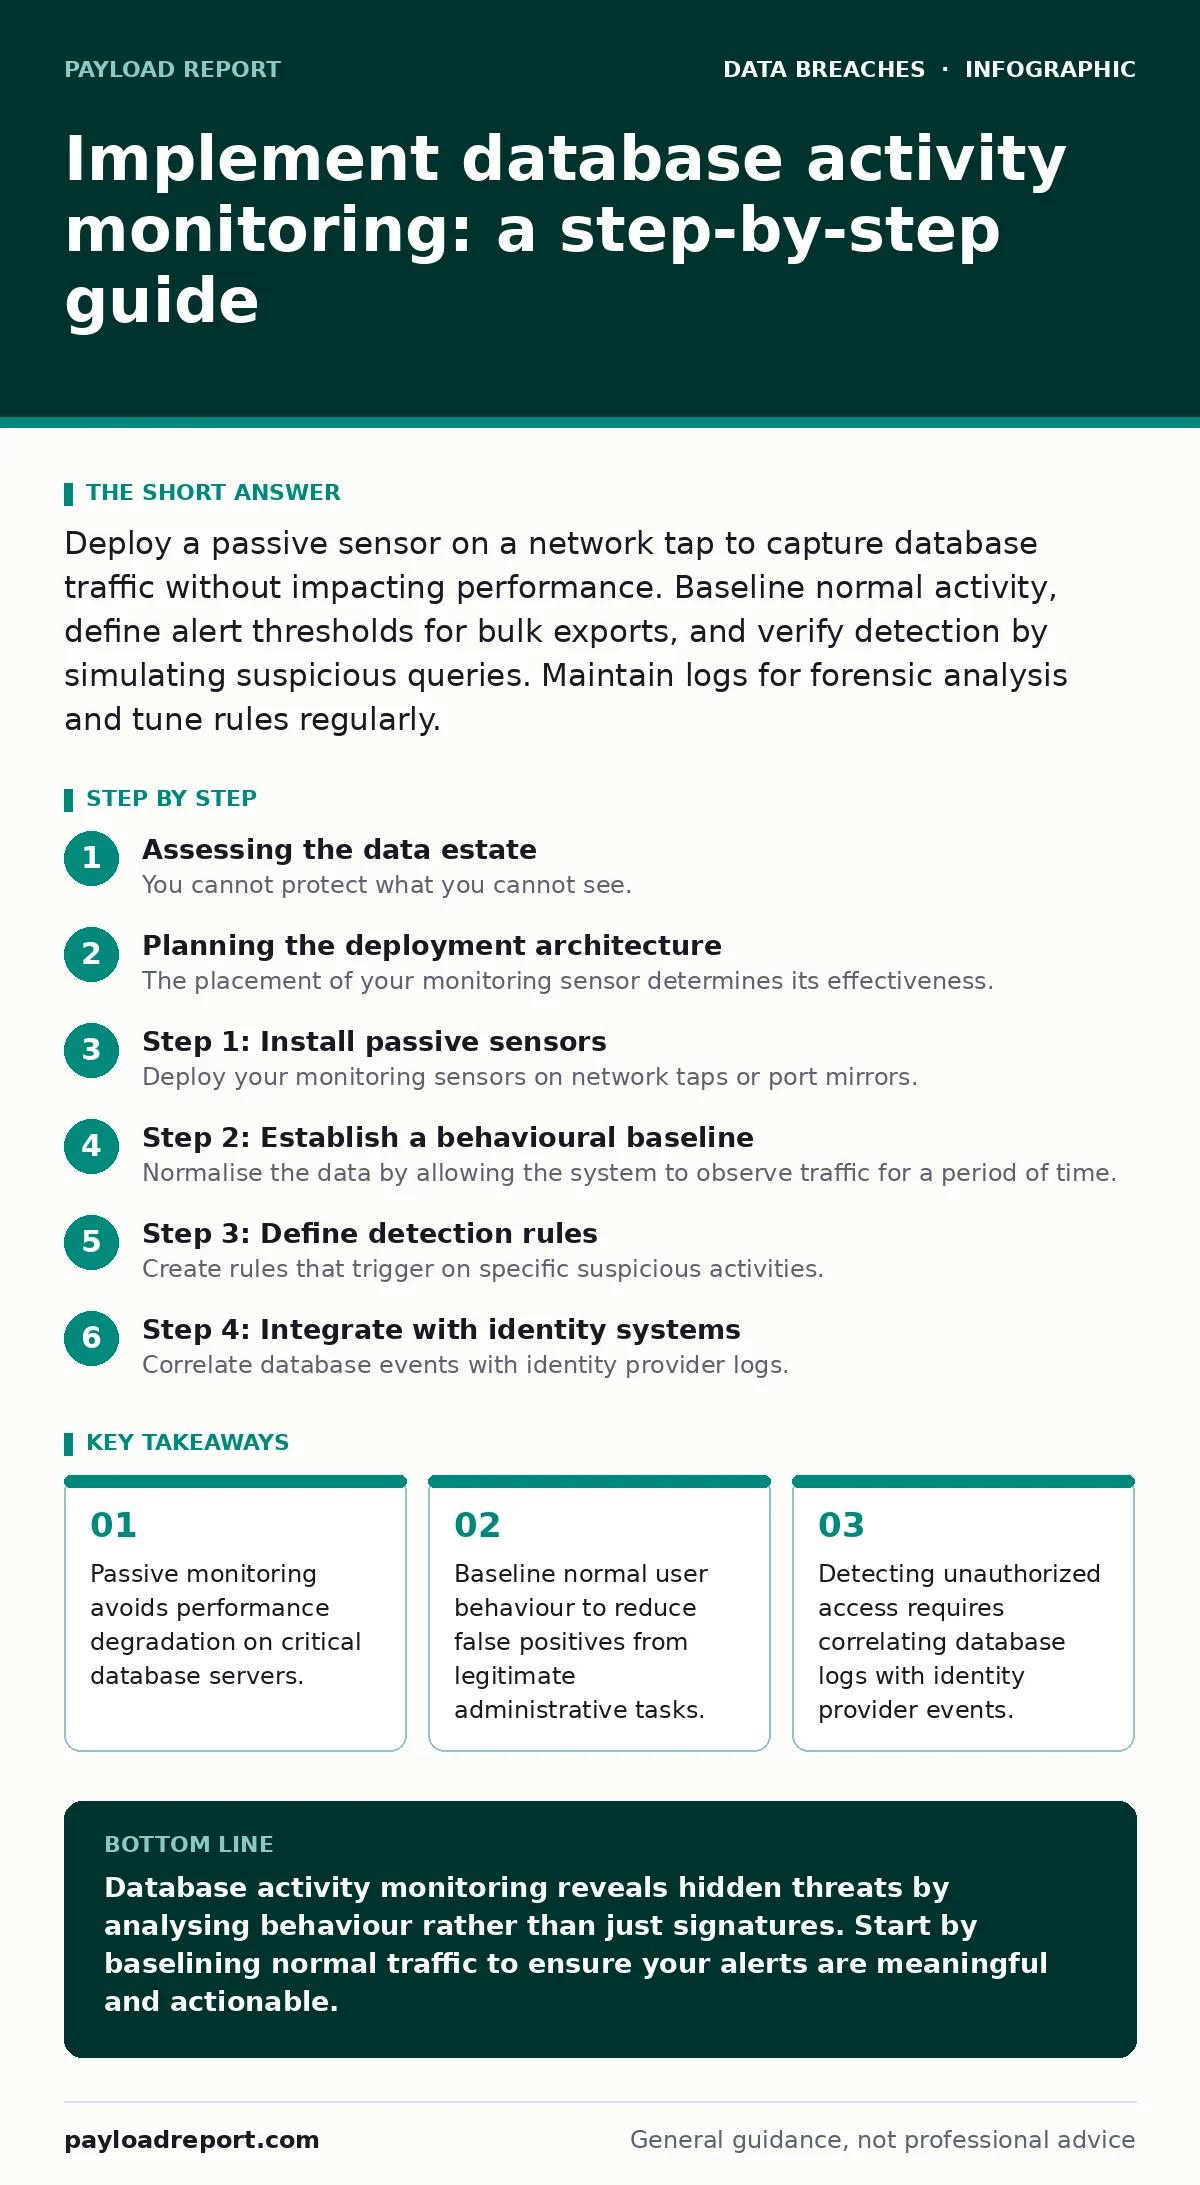
Deploy a passive sensor on a network tap to capture database traffic without impacting performance. Baseline normal activity, define alert thresholds for bulk exports, and verify detection by simulating suspicious queries. Maintain logs for forensic analysis and tune rules regularly.
Assessing the data estate
You cannot protect what you cannot see. Before deploying any monitoring tool, you must map every database instance, including development environments and shadow IT systems. Many organisations overlook legacy systems that store sensitive data but lack modern security controls. These forgotten corners become the easiest entry points for attackers.
Identify which databases hold the most sensitive information. Prioritise those containing personally identifiable information, financial records, or intellectual property. This prioritisation ensures you focus your limited resources on the assets that matter most. It also helps you understand the baseline traffic patterns for each system.
Planning the deployment architecture
The placement of your monitoring sensor determines its effectiveness. A network tap provides a passive copy of traffic, ensuring the monitoring process does not interfere with database performance. Inline deployment can introduce latency, which is unacceptable for high-throughput production systems.
Consider the volume of traffic. Databases generate massive amounts of data, and capturing everything can overwhelm storage and processing capabilities. You may need to filter traffic at the source to capture only relevant packets. This reduces noise and ensures you retain forensic data for longer periods.
Step 1: Install passive sensors
Deploy your monitoring sensors on network taps or port mirrors. This ensures the monitoring system receives a complete copy of the traffic without touching the live network path. Verify that the sensor is capturing packets for the specific database ports and protocols you intend to monitor.
Check the sensor status to confirm it is receiving data. You should see a steady stream of packets corresponding to normal database activity. If the packet count is zero, check the physical connections and the configuration of the port mirror. A silent sensor provides no protection and creates a false sense of security.
Step 2: Establish a behavioural baseline
Normalise the data by allowing the system to observe traffic for a period of time. This phase identifies typical query patterns, user behaviours, and connection frequencies. Without a baseline, every query looks suspicious, leading to alert fatigue.
Review the initial alerts generated during this period. Most will be false positives caused by legitimate administrative tasks or scheduled jobs. Adjust your thresholds to ignore these known good patterns. This tuning process is critical for ensuring that future alerts represent genuine anomalies.
Step 3: Define detection rules
Create rules that trigger on specific suspicious activities. Look for bulk data exports, login attempts from unusual locations, or queries that access sensitive tables outside of business hours. These indicators often signal an attacker who has gained unauthorized access and is attempting to exfiltrate data.
Ensure your rules account for the context of the user. A database administrator running a bulk export during maintenance is normal. The same action by a standard user at midnight is not. Contextual awareness reduces noise and increases the relevance of your alerts.
See also: How to Write Customer Breach Notification Letters That Limit Liability
Step 4: Integrate with identity systems
Correlate database events with identity provider logs. This step connects the technical action to a specific user or service account. It helps you determine if the activity is authorised, even if the technical pattern looks suspicious.
Verify that timestamps align between the database logs and the identity provider. Misaligned clocks can make it difficult to reconstruct an attack timeline. Ensure your monitoring system can ingest identity data in real time to provide immediate context for alerts.
Step 5: Test detection capabilities
Simulate suspicious activity to verify your monitoring works. Imagine a user account that suddenly starts querying all customer records. Trigger this scenario and observe if the system generates an alert. This test confirms that your rules are active and your sensors are capturing the right data.
If the alert does not fire, review your rule configuration and sensor placement. Ensure the simulated traffic matches the pattern defined in your rules. Repeat the test until you achieve consistent detection. This validation step is vital for building confidence in your monitoring programme.
Step 6: Establish response procedures
Define how your team will respond to alerts. Not every alert requires immediate action. Some may be benign anomalies that require investigation but not containment. Create a playbook that outlines the steps for triage, investigation, and escalation.
Ensure your team knows how to isolate a compromised database if necessary. This may involve blocking specific IP addresses or disabling user accounts. Quick response limits the damage of a breach. Practice these procedures regularly to ensure they work under pressure.
Verification checklist
Use this checklist to confirm your implementation is effective.
- Sensors are installed on network taps or port mirrors.
- Traffic capture covers all critical database instances.
- Baseline period has been completed and reviewed.
- Detection rules are tuned to reduce false positives.
- Identity correlation is active and timestamps align.
- Detection tests have been performed and passed.
- Response procedures are documented and understood.
Ongoing upkeep and tuning
Database activity monitoring is not a set-and-forget solution. You must regularly review alerts and tune your rules. New applications and changes in user behaviour will alter the baseline. Ignoring these changes leads to increased noise and missed detections.
Rotate credentials and review access rights periodically. Ensure that only authorised users have access to sensitive databases. This reduces the attack surface and limits the impact of compromised accounts. Combine this with encryption at rest to protect data even if it is stolen.
Consider integrating your monitoring data with a security information and event management system. This provides a centralised view of security events across your entire infrastructure. It helps you correlate database activity with other indicators of compromise.
Handling incident response
When an alert triggers, follow your response procedures. Investigate the source of the activity and determine if it is malicious. If it is, contain the threat by isolating the affected system. Preserve logs for forensic analysis.
If the breach involves personal data, you may need to comply with regulations such as the GDPR breach notification rule. Timely notification is required to maintain trust and avoid penalties. Coordinate with legal and communications teams to manage the response.
Long-term strategy
Database activity monitoring is part of a broader security strategy. Combine it with other controls such as fraud alerts and credit freezes to protect your customers. These measures limit the damage of a breach and demonstrate your commitment to security.
Regularly update your monitoring tools and rules. Threats evolve, and your defences must evolve with them. Stay informed about new attack techniques and adjust your monitoring accordingly. This continuous improvement ensures your security posture remains strong.
Key takeaways
- Passive monitoring avoids performance degradation on critical database servers.
- Baseline normal user behaviour to reduce false positives from legitimate administrative tasks.
- Detecting unauthorized access requires correlating database logs with identity provider events.
Database activity monitoring reveals hidden threats by analysing behaviour rather than just signatures. Start by baselining normal traffic to ensure your alerts are meaningful and actionable.
Frequently asked questions
Does database activity monitoring slow down my database?
No, if you use passive sensors on network taps. Inline deployment can introduce latency, so avoid it for production systems.
How do I reduce false positives?
Establish a baseline of normal activity and tune your rules to ignore known good patterns. Contextual awareness helps distinguish between legitimate and suspicious behaviour.
Can this detect insider threats?
Yes, by monitoring for unusual access patterns or bulk data exports by authorised users. It helps identify compromised accounts or malicious insiders.
Do I need this for every database?
Prioritise databases containing sensitive data. You can expand coverage to other systems as resources allow, focusing on risk.
How this guide was produced: written by the Payload Report editorial team with AI assistance, checked against the public references listed below, and reviewed when the facts change. See our editorial policy or report an error.